Jump to content

the stivo warms up... dyno today


Recommended Posts


dyno done =) with some impressive figures, i expected about 105kw but was a bit higher =)

got it done at premier @ Mt druitt. they have an awesome setup there 4wd dyno built into the ground! very impressive... had three runs on the dyno first run pulled 114kw, second was 115kw and third and final was at 116.5kw i thought that was outstanding!

that damned grin on my face... lol its still there =)

any feedback is appreciated

Picture -> 28733-2004522203414.jpg

Link - > http://www.amihotornot.com.au/album/view_p...d.asp?id=112915

Link to comment
Share on other sites


Hey mike, dun mean to doubt your results or cast any sort of negativity but i came across this a couple of months ago and i thought i might take this opportunity to share this.

It's taken off http://www.sdsefi.com/techdyno.htm

Dyno Thoughts and HP Losses

After reading various articles in numerous publications on dynos and horsepower, I feel I should put forth a few observations:

Chassis dynos are great tuning aids but they only give a approximation of power output as some of the important variables are not accurately controlled. Certain magazines seem to think that results obtained from chassis dynos are the gospel. They are not. In one recent independent test, hp figures varied by 11% simply by doing the runs in different gears and in another test, results varied by almost 4 % by doing the runs with a different wheel/tire combination. Tire alignment has been shown to affect results up to 3% as well. Note that Engine hp DID NOT change here yet the dyno recorded an increase in hp at the wheels. A change in wheels/tires also does not affect true, wheel hp either, only the rate of change on the rollers and the vehicle acceleration on the road. One can only conclude that inaccurate moments of inertia and correction factors are being used.

On intercooled, turbo cars, there is usually insufficient airflow to ensure accurate results due to charge temperature variation which can be substantial. Even coolant temperatures may not stay down during the run which can affect power outputs considerably. The rate of acceleration is also important on turbo cars to be sure that the boost is not lagging the engine rpm. With RPM climbing too quickly, the boost has not reached a peak value so the hp figure is again inaccurate. Turbo cars should therefore be tested in top gear.

Without proper temperature stability and accurate moments of inertia on the rotating components, there CANNOT be accurate results as the scientific method is no longer being applied.

When all things are kept the same between runs and you get a tangible gain, it is a gain at least. How much, is open for discussion. It is important to note that as the oil temperatures in the engine, transmission and differential increase, friction usually decreases. This manifests itself as an increase in power at the rollers on each subsequent test. This factor should be accounted for when doing back to back runs. It may look like you are gaining some power on each run by making other changes when in fact this is due to reduced oil viscosity. When using a chassis dyno, always use the same gear and tires and wheels and start the runs from the same speed or RPM. Re-baseline periodically to see what temperature increases have done to power output.

Chassis dynos are quick and easy to hook up but have many of the above failings. They do not possess the accuracy of a properly calibrated engine dyno which has a more carefully controlled environment and condition set. Obviously, most non-professionals don't want to be yanking engines to use an engine dyno so chassis dynos do have their place.

Flywheel vs. Wheel HP

As most people know, there are power losses through the drivetrain so wheel hp is always lower than flywheel hp. Front wheel drive cars with transverse engines tend to be more efficient than most rear drive configurations due to the layout of components. However most publications overestimate these losses considerably.

Most rear drive cars have a 1 to 1, 4th gear which means that the power path goes directly through the mainshaft of the transmission. The only losses here are bearing drag which is less than 0.5% and the viscous drag of the gears running through the oil which is about 1% with hot oil. Indeed, published data indicates a transmission efficiency of 98 to 98.5% for conventional transmissions in 4th gear.

Losses within the driveshaft account for about 0.5% if they are properly aligned, balanced and with fresh U-joints.

Differential losses in the commonly used Hypoid type ge****t is in the order of 6 to 10%.

The worst scenario case for a rear drive setup is on the order of 12.5% in 4th gear, not the 20 -25% often published. If 25% was being lost in the drivetrain, the oil would boil in the differential housing in short order and aluminum transmission cases would fatigue and break from the temperatures generated. On a 200 hp engine, something on the order of 37,000 watts would have to be dissipated out of the transmission and differential housings. Obviously, this is not the case.

Transverse, front drive transaxles usually have no direct lockup gears and no 1 to 1 ratio, however, since the torque path is never turned 90 degrees as in the rear drive setup and efficient helical gears are usually employed for the final drive set, losses are more on the order of 6 to 9 percent in the upper ratios.

Tire pressure and wheel alignment can have very significant effects on losses at the rollers. Tire pressures should be set the same between each test. Tire rolling resistance varies inversely with speed, another factor not taken into account by most chassis dynos when applying phantom flywheel hp formulas.

Comparing the Numbers

Many novices are quick to compare hp numbers between chassis and engine dynos and come up with all sorts of wild conclusions about drivetrain losses. These comparisons are essentially meaningless. Inertial dynos are based on the sound scientific priciple of accelerating a certain mass with a known moment(distance) over a given time. The rate of acceleration of that mass and moment is a result of the force applied (torque). If the RPM is known, HP can be calculated. On an inertial chassis dyno, it is virtually impossible to calculate the the moment of inertia of every tire, wheel, gear, joint , axle and shaft in the power train between the crankshaft and roller, therefore its results cannot offer an accurate HP figure. Even with coastdown drag measurements, these cannot be accurately calculated as different factors are affected in different ways. Some are proportional, some are inverse squared functions etc. Inertial engine dynos offer a very accurate figure if properly calibrated as only the flywheel's moment of inertia needs to be calculated and added to that of the billet. Water brake or eddy current dynos generally measure force (torque) directly through a ram or strain gauge so moments of inertia are not important on these in fully loaded tests.

Concluding that there was a 25% drivetrain loss by comparing HP achieved on an inertial chassis dyno and that obtained on an engine dyno is fundamentally flawed in that the chassis dyno numbers are highly suspect in the first place.

Other things to watch are correction factors applied for altitude, barometric pressure and temperature. These factors are NOT the same for atmo and turbo engines. Using atmo factors inflates the true, corrected HP figures on a turbo engine. In fact, look at the correction factor applied on your dyno sheets and see if they make sense. Many shady dyno operators simply enter a phantom correction factor to make the customer happy. This is a case where the dyno sheet DOES lie. Chassis dynos are essentially for tuning purposes, they are not well suited to giving an accurate hp figure.

Be aware that SAE correction factors do not apply to turbocharged engines! If your dyno sheet lists SAE corrected HP, ignore it as it is incorrect. You are better off getting an idea of where you stand by looking at observed hp with a turbo engine.

One of my friends recently received a well known commercially available chassis dyno with both inertial and eddy current loading capability. When a different vehicle weight is entered in the software for a pull, the computer spits out a dyno sheet with vastly different hp figures. This is complete BS and shows that the software package is just plain wrong. HP did NOT change on the pull simply because a different weight was plugged into the computer. Take all these figures with a grain of salt. I had an engineer from this company E-mail me and tell me their dynos were accurate. I told him I'd be happy to look at his data and asked him to send me his information to support this claim. I never heard back. Changing the weight DOES NOT change the hp the engine puts out PERIOD!

Another SDS customer had his drag car chassis dynoed. It showed a max hp of 280 yet when the car weight, ET and trap speed were plugged in, these showed that around 500hp was required to achieve these results. The dyno figure was so far off, it was essentially useless.

Looking at the jagged, sawtooth "curve" that most chassis dynos produce is amusing. The torque and hp curves really don't look like this. This is a result of poor software or mechanical measurement in the first place. Torque does not go up down, up down 2-4 ft./lbs. over 50-100 rpm as any real engine dyno will prove. Chassis dynos are essentially tuning aids, not true hp measurement devices. Use them to dial in your EMS mapping, not to brag to your friend's that you made XXX hp. When he blows you away at the stoplight, you'll just look, just, well, uninformed.

Link to comment
Share on other sites

what gear were you in?

was it shoot out mode? that makes a huge difference.

a i just came back from an engagement where i was best man, im smashed...

good result 116kw.....

3rd gear,

yeah shoot out... had first run let it cool for 5mins then went again....

yeah im happy with 116

Link to comment
Share on other sites

why is there so much doubt about these figures? technically the stivo should be able to reach 116kw stock, true?

stivo run in properly? i have 16,600km on mine and i give the old gal hell but in the same context i look after it, i use mobile1 full syntetic and i change the oil&oil filter every 5000. i changed it again first thing yesterday morning before my run on the dyno....

all i can say is with the right preping figures like that wouldnt be hard to achieve.. why bother getting it dynoed if you havent done all this first.

sum it up;

1. oil changed (mobile one synthetic) & oil filter

2. BP 98octane fuel

3. stp octane booster

4. trd cold air with a 2 week oil k&n filter

5. had the big Fan on the front of the car

6. temperature yesterday when it was done was 13degrees

7. exhaust tip mod.

believe it or not 3 runs proved these figures, i will further get it dynoed on another dyno elsewhere to remove any doubt in peoples mind.

Link to comment
Share on other sites

People are just doubting it now because it was in shootout mode I believe, which has been proven to be a bit dodge sometimes and give higher figures.

Not me though, a dyno is a dyno, good on you man! Keep that grin on your face as you drive past all the other cars that try to drag you... :D

Link to comment
Share on other sites

I think Shaohaok had explained very clearly what a dyno run is for. NOT to be used to compare hp figures between cars. It is a tool for tuning purposes if you decide to modify your car. Even as a tuning tool, the chassis dyno can still produce misleading figures. We have now seen some stivos produce 90kw atw and some producing 116kw, but far too many factors influence horsepower results. Similarly for acceleration times and lap times.

Link to comment
Share on other sites

03Mike - Nicely done mate ;) now you have a nice benchmark to work from for your continuing mods :D. As zee/shao pointed out it is a platform from which to use as a benchmark for YOUR car in the times to come.

Shao - as per usual a great source of technical and interesting reading ;)

Guys - #1 thing to remember yet again about modifying cars. It's not all about kW/BHP

Shao had a 'very' similar result with his sportivo with only a CAI and muffler ( I was there with him) so these figures are a very true representation of a stock stivo with a few tid bits :D

IMHO - the TRD CAI is bang for buck the best mod for our car atm

Again Well done Mike i bet the smile will be there for another 3 weeks yet :D :D :D

Link to comment
Share on other sites

Hi Mike,

good figures. I might give TJ a call and organise something with you as well to go to where u dyno'ed ur car and see how i go. I have 2 other sets of dyno sheets but non done with the perperation u performed so when im ready will get TJ to give u a buzz or something.

again good results

Cheer

Bill

Link to comment
Share on other sites

Interesting that you got those figures good for you that you are happy. But each Dyno produces diffrent figures, also the temp of the day...blah blah. I would agree with shaohoak. I have the mods than Danthuyer has and a few more and technically I should be getting more power than you, with extractors and the Unichip. But each engine has it's own characteristics. And comparisons from one motor to anther can even differ on the same dyno though they maybe the same make and model. But it still be interesting to take mine or Danthuyers car and see how yours compares on the same dyno with the same conditions. And when we did ours we did not use octane boost either. Keep going with the mods I will be .... and keep smiling.

Link to comment
Share on other sites

Why only 3rd gear though? The lower the gear obviously the more power would be displayed out

It should be a 1:1 ratio. Where the engine and wheels spin the same

5 Speed = 4th gear

6 Spd = 5th Gear

Thats when the engines really making those power at the wheels. Ive done tests in 3rd and 4th gear.

3rd 80KW, 4th 65KW

done at the same dyno place as yours sunblest cresent

Link to comment
Share on other sites

SXN16V has a point to get the truest figure on a chasis dyno the run should be done in the gear that is closest to a 1:1 ratio, which for the C60 gearbox would be 5th, as below data shows (from www.toyota.com.au)

Transmission description Six speed manual

- Transmission code C60

Gear Ratios

- 1st Gear 3.166:1

- 2nd Gear 2.050:1

- 3rd Gear 1.481:1

- 4th Gear 1.166:1

- 5th Gear 0.916:1

- 6th Gear 0.725:1

- Reverse Gear 3.250:1

Differential ratio 4.529:1

But as has been said before

It is a tool for tuning purposes if you decide to modify your car. Even as a tuning tool, the chassis dyno can still produce misleading figures.
The way to compare dyno figures between 2 cars is to remove all the variables i.e same Dyno, Day, gear, tire pressure, wheel\tire size...blah blah blah.. even then there are all sorts of things that can vary figures. A 0-400m time slip would be a better comparison as it is a combination of car performance and driver skill.... what good is a fast car if you cant drive it????
Link to comment
Share on other sites

...the software version the dyno is running also plays a big part in the numbers, as does it's calibration.

In Brisbane, a friend of mine had their car dyno'd at one tuner on a friday and made 105kw ATW, the following day his car club had a dyno day at another tuner also using a dyno-dynamics machine in Brisbane, and the same car made 130kw ATW... With absolutely no mods done to the car in between the two runs. So that was a 25Kw atw difference on the SAME car on the SAME type of dyno...

Dyno's are tuning tools, I take most figures from dyno's with a grain of salt. The 1/4 mile times and trap speeds are a better indication of real "power" so to speak.

I'd be interested to see a sportivo graph done in 5th, and a normal levin/ascent/whatever run in 4th on the same dyno (C52 in the levin has 4th gear close enough to 1:1). That would be an interesting comparison, especially the tractive effort plots.

Link to comment
Share on other sites

do those gear ratios take into consideration final drive?

i agree with Shaohaok. Chassis dynos have always been good for giving an indication of Hp but will not always give true HP. As someone has always said, HP is not everthing. it is a simply a book-keeping figure that is ONE indicator to the drivability of any car. there are many more and arguably more important factors in the outright performance of a car.

but with that said, the power figure Mike got on the dyno looks ok to me from what i've seen and read elsewhere. The sportivo certainly feels fast to me :P I saw a Honda S2000 pull ~117Kw ATW on a chassis dyno at AutoSalon Final battle 2003. even though the power figures aren't really that far off, i still got my **** walloped buy one the other night. we were cruizing around at 80km/h for a few km. I guess he must have gotten sick of me next to him so he downshifted and just punched it! the thing litterally took off like a rocket! in reaction, i floored it but it was too late. he was long gone! the power to weight of the s2000 must be phenominal! :blink:

don't worry guys. i wouldn't be silly enough to take on an s2000 for real! :lol: otherwise, there goes our street cred! hahhaa

btw Shaohaok, it took me two days to finish your post! hahaha. i read half and got tired and didn't read the other half until today. :lol:

Link to comment
Share on other sites

  • 2 years later...

SXN16V has a point to get the truest figure on a chasis dyno the run should be done in the gear that is closest to a 1:1 ratio, which for the C60 gearbox would be 5th, as below data shows (from www.toyota.com.au)

Transmission description Six speed manual

- Transmission code C60

Gear Ratios

- 1st Gear 3.166:1

- 2nd Gear 2.050:1

- 3rd Gear 1.481:1

- 4th Gear 1.166:1

- 5th Gear 0.916:1

- 6th Gear 0.725:1

- Reverse Gear 3.250:1

Differential ratio 4.529:1

But as has been said before

It is a tool for tuning purposes if you decide to modify your car. Even as a tuning tool, the chassis dyno can still produce misleading figures.
The way to compare dyno figures between 2 cars is to remove all the variables i.e same Dyno, Day, gear, tire pressure, wheel\tire size...blah blah blah.. even then there are all sorts of things that can vary figures. A 0-400m time slip would be a better comparison as it is a combination of car performance and driver skill.... what good is a fast car if you cant drive it????

Just for anyone who wants the Gear Ratios for the 1zz-fe, here they are

- 1st Gear 3.166:1

- 2nd Gear 1.904:1

- 3rd Gear 1.310:1

- 4th Gear 0.969:1

- 5th Gear 0.815:1

- Reverse Gear 3.250:1

- Differential ratio 4.312:1

can someone please tell me what all these gear ratios mean? and how do we determine the shift point where the most power is to be had? I know i've gone a bit off topic but if you's dont mind answering it here, that'd be great.

Steve~

Link to comment
Share on other sites

Shift points depend on your power/torque curves. Gear ratios don't play that great a role when selected towards performance. But long story short, the best acceleration for your car would be to shift just before the rev limiter.

Link to comment
Share on other sites

A Hi-Lux has gear ratios geared towards low down torque. But the 1zz is geared taller, more towards a trade off between economy and performance. You could change the gear set to be more performance orientated. But working on suspension set-up (or driver skill) would net the same (or more) amount of time over a lap and cost a lot cheaper than buying custom gear ratios.

What I am trying to get at is more time and money is better spent trying to improve other areas than the gear ratios on a car that already has good ratios to start with.

Edit: I still don't think I explained it very well, but oh well.

Edited by SuperDave
Link to comment
Share on other sites

Join the conversation

You can post now and register later. If you have an account, sign in now to post with your account.

Guest
Reply to this topic...

×   Pasted as rich text.   Paste as plain text instead

  Only 75 emoji are allowed.

×   Your link has been automatically embedded.   Display as a link instead

×   Your previous content has been restored.   Clear editor

×   You cannot paste images directly. Upload or insert images from URL.


  • Join The Club

    Join the Toyota Owners Club and be part of the Community. It's FREE!

  • Latest Postings

    1. 1

      Drive shafts

    2. 0

      FUSE BOXES ALLOCATION - 1996 SUPER CUSTOM Model (Import)

    3. 10

      Vibration through body (not steering wheel) under acceleration

    4. 0

      possible fit 2015 kluger Grnde driver seat on 2019 kluger GX

    5. 0

      front brake calipers

    6. 1

      Drive shafts

    7. 315

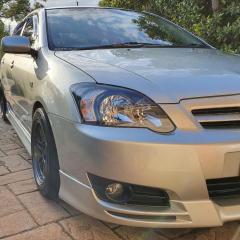
      New to Toyota - 2005 Corolla Sportivo!

    8. 10

      Vibration through body (not steering wheel) under acceleration

    9. 0

      P0420 Catalystic converter below Thrushold

    10. 0

      Dashlight dimmer

×
×
  • Create New...

Forums


News


Membership